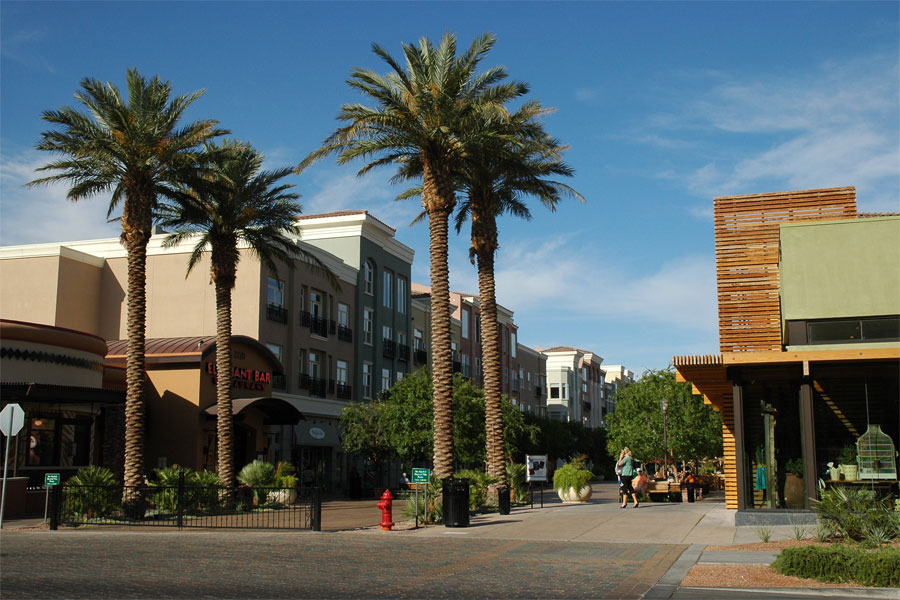
Nevada · Mountain West
Henderson, NV
Average score
62/100
- Population
- 350,039
- Median home
- $484,900
Side-by-side
Scores are 0–100, higher is better. “Best in row” marks the one place with the highest score on a measure.
The plates show each place’s average across every measure. Take the two-minute survey to see your own fit →
Nevada · Mountain West
Average score
62/100

Nevada · Mountain West
Average score
59/100
Where they differ
The 5 measures with the widest gap between the scores.
A · HendersonB · Boulder City
The full table
Scores are 0–100, higher is better. Best in row marks the one highest score; equal scores are not marked.
| Measure | Henderson, NV | Boulder City, NV | |||||||||||||||||||||||||||||||||||||||||||||||||||||||||||||||||||||
|---|---|---|---|---|---|---|---|---|---|---|---|---|---|---|---|---|---|---|---|---|---|---|---|---|---|---|---|---|---|---|---|---|---|---|---|---|---|---|---|---|---|---|---|---|---|---|---|---|---|---|---|---|---|---|---|---|---|---|---|---|---|---|---|---|---|---|---|---|---|---|---|
Cost & Taxes | 65 | 68 | |||||||||||||||||||||||||||||||||||||||||||||||||||||||||||||||||||||
| Affordability | 49 | 49 | |||||||||||||||||||||||||||||||||||||||||||||||||||||||||||||||||||||
| Housing cost | 49 | 54 | |||||||||||||||||||||||||||||||||||||||||||||||||||||||||||||||||||||
| Low state taxes | 73 | 73 | |||||||||||||||||||||||||||||||||||||||||||||||||||||||||||||||||||||
| Low property tax | 90 | 97 | |||||||||||||||||||||||||||||||||||||||||||||||||||||||||||||||||||||
What’s measuredAffordability
Housing cost
Low state taxes
Low property tax
| |||||||||||||||||||||||||||||||||||||||||||||||||||||||||||||||||||||||
Work & Economy | 73 | 48 | |||||||||||||||||||||||||||||||||||||||||||||||||||||||||||||||||||||
| Job market | 50 | 50 | |||||||||||||||||||||||||||||||||||||||||||||||||||||||||||||||||||||
| Remote-work infrastructure | 79 | 63 | |||||||||||||||||||||||||||||||||||||||||||||||||||||||||||||||||||||
| Growing community | 90 | 31 | |||||||||||||||||||||||||||||||||||||||||||||||||||||||||||||||||||||
What’s measuredJob market
Remote-work infrastructure
Growing community
| |||||||||||||||||||||||||||||||||||||||||||||||||||||||||||||||||||||||
Climate & Weather | 75 | 75 | |||||||||||||||||||||||||||||||||||||||||||||||||||||||||||||||||||||
| Warm climate | 93 | 100 | |||||||||||||||||||||||||||||||||||||||||||||||||||||||||||||||||||||
| Cool climate | 7 | 0 | |||||||||||||||||||||||||||||||||||||||||||||||||||||||||||||||||||||
| Four seasons | 100 | 100 | |||||||||||||||||||||||||||||||||||||||||||||||||||||||||||||||||||||
| Sunshine | 98 | 98 | |||||||||||||||||||||||||||||||||||||||||||||||||||||||||||||||||||||
| Low humidity | 92 | 92 | |||||||||||||||||||||||||||||||||||||||||||||||||||||||||||||||||||||
| Winter daylight | 58 | 58 | |||||||||||||||||||||||||||||||||||||||||||||||||||||||||||||||||||||
What’s measuredWarm climate
Cool climate
Four seasons
Sunshine
Low humidity
Lower is drier. Winter daylight
| |||||||||||||||||||||||||||||||||||||||||||||||||||||||||||||||||||||||
Nature & Environment | 62 | 62 | |||||||||||||||||||||||||||||||||||||||||||||||||||||||||||||||||||||
| Outdoor recreation | 74 | 78 | |||||||||||||||||||||||||||||||||||||||||||||||||||||||||||||||||||||
| Public land access | 99 | 99 | |||||||||||||||||||||||||||||||||||||||||||||||||||||||||||||||||||||
| Near the ocean or a Great Lake | 12 | 11 | |||||||||||||||||||||||||||||||||||||||||||||||||||||||||||||||||||||
| Air quality | 37 | 37 | |||||||||||||||||||||||||||||||||||||||||||||||||||||||||||||||||||||
| Drinking water | 86 | 86 | |||||||||||||||||||||||||||||||||||||||||||||||||||||||||||||||||||||
What’s measuredOutdoor recreation
Public land access
Near the ocean or a Great Lake
Air quality
Lower is cleaner. Drinking water
Regulatory violations, not taste or hardness. | |||||||||||||||||||||||||||||||||||||||||||||||||||||||||||||||||||||||
Safety & Health | 75 | 75 | |||||||||||||||||||||||||||||||||||||||||||||||||||||||||||||||||||||
| Low crime | 77 | 85 | |||||||||||||||||||||||||||||||||||||||||||||||||||||||||||||||||||||
| Low disaster risk | 73 | 73 | |||||||||||||||||||||||||||||||||||||||||||||||||||||||||||||||||||||
| Health care access | 75 | 67 | |||||||||||||||||||||||||||||||||||||||||||||||||||||||||||||||||||||
What’s measuredLow crime
Low disaster risk
Health care access
| |||||||||||||||||||||||||||||||||||||||||||||||||||||||||||||||||||||||
Getting Around | 66 | 65 | |||||||||||||||||||||||||||||||||||||||||||||||||||||||||||||||||||||
| Walkability | 53 | 45 | |||||||||||||||||||||||||||||||||||||||||||||||||||||||||||||||||||||
| Public transit | 40 | 27 | |||||||||||||||||||||||||||||||||||||||||||||||||||||||||||||||||||||
| Short commutes | 48 | 67 | |||||||||||||||||||||||||||||||||||||||||||||||||||||||||||||||||||||
| Airport access | 90 | 89 | |||||||||||||||||||||||||||||||||||||||||||||||||||||||||||||||||||||
| Close to a major city | 100 | 97 | |||||||||||||||||||||||||||||||||||||||||||||||||||||||||||||||||||||
What’s measuredWalkability
Public transit
Short commutes
Airport access
Close to a major city
| |||||||||||||||||||||||||||||||||||||||||||||||||||||||||||||||||||||||
Amenities & Entertainment | 78 | 77 | |||||||||||||||||||||||||||||||||||||||||||||||||||||||||||||||||||||
| Cultural amenities | 99 | 94 | |||||||||||||||||||||||||||||||||||||||||||||||||||||||||||||||||||||
| Performing arts & museums | 100 | 100 | |||||||||||||||||||||||||||||||||||||||||||||||||||||||||||||||||||||
| Golf course access | 36 | 36 | |||||||||||||||||||||||||||||||||||||||||||||||||||||||||||||||||||||
What’s measuredCultural amenities
Performing arts & museums
Golf course access
| |||||||||||||||||||||||||||||||||||||||||||||||||||||||||||||||||||||||
Community & People | 45 | 40 | |||||||||||||||||||||||||||||||||||||||||||||||||||||||||||||||||||||
| Small-town feel | 54 | 95 | |||||||||||||||||||||||||||||||||||||||||||||||||||||||||||||||||||||
| Big-city feel | 41 | 0 | |||||||||||||||||||||||||||||||||||||||||||||||||||||||||||||||||||||
| Younger community | 38 | 0 | |||||||||||||||||||||||||||||||||||||||||||||||||||||||||||||||||||||
| Older community | 62 | 100 | |||||||||||||||||||||||||||||||||||||||||||||||||||||||||||||||||||||
| Diversity | 66 | 31 | |||||||||||||||||||||||||||||||||||||||||||||||||||||||||||||||||||||
| Educated population | 48 | 36 | |||||||||||||||||||||||||||||||||||||||||||||||||||||||||||||||||||||
| Conservative community | 46 | 46 | |||||||||||||||||||||||||||||||||||||||||||||||||||||||||||||||||||||
| Progressive community | 54 | 54 | |||||||||||||||||||||||||||||||||||||||||||||||||||||||||||||||||||||
| Religious community | 0 | 0 | |||||||||||||||||||||||||||||||||||||||||||||||||||||||||||||||||||||
What’s measuredSmall-town feel
Big-city feel
Younger community
Older community
Diversity
Educated population
Conservative community
Progressive community
Religious community
| |||||||||||||||||||||||||||||||||||||||||||||||||||||||||||||||||||||||
Families & Schools | 35 | 42 | |||||||||||||||||||||||||||||||||||||||||||||||||||||||||||||||||||||
| Education | 45 | 48 | |||||||||||||||||||||||||||||||||||||||||||||||||||||||||||||||||||||
| Private school selection | 17 | 17 | |||||||||||||||||||||||||||||||||||||||||||||||||||||||||||||||||||||
| Affordable childcare | 44 | 44 | |||||||||||||||||||||||||||||||||||||||||||||||||||||||||||||||||||||
| Childcare availability | unknown | 58 | |||||||||||||||||||||||||||||||||||||||||||||||||||||||||||||||||||||
What’s measuredEducation
Private school selection
Affordable childcare
Childcare availability
| |||||||||||||||||||||||||||||||||||||||||||||||||||||||||||||||||||||||
The measured figures behind the scores, county or state level where the label says so. Every figure and its source is on each place’s page.
| Figure | Henderson, NV | Boulder City, NV |
|---|---|---|
| Population | 350,039 | 15,029 |
| Price Level (BEA RPP) | 100.2 (avg=100) | 100.2 (avg=100) |
| Median Home Price | $484,900 | $435,600 |
| Median Rent / mo | $1,824 | $1,427 |
| State Income Tax (top) | None | None |
| Sales Tax (state + avg local) | 8.24% | 8.24% |
| Unemployment Rate | 5.4% | 5.4% |
| Broadband Subscription | 95% | 92% |
| Coworking / 100k | unknown | 1.7 |
| Violent Crimes / 100k (FBI) | 225.2 | 159.3 |
| Property Crimes / 100k (FBI) | 1,501.8 | 829.9 |
| Jan High (°F) | 58.5°F | 65.5°F |
| Jul High (°F) | 104.5°F | 111.9°F |
| Possible Sunshine | 84% | 84% |
| July Dew Point (°F) | 42.7°F | 42.7°F |
| Annual Snow (in) | 0.2" | 0.0" |
| Annual Rain (in) | 4.2" | 5.0" |
| Annual AQI | 64 | 64 |
| Physicians / 100k (county) | 229 | 229 |
| Hospital Beds / 100k | 165 | 165 |
| Miles to 3+ Star Hospital | 4.9 mi | 16 mi |
| Residents on a system w/ violation | 1% | 1% |
| Walkability Index (EPA) | 10.9/20 | 9.9/20 |
| Transit Trips / hour | 6.0 | 2.7 |
| Avg Commute (min) | 24.3 min | 23.2 min |
| Congestion Delay (h/yr) | 57 h | unknown |
| Major Airports (60 mi) | 2 | 2 |
| Public Land % (county) | 58% | 58% |
| Miles to the Coast (ocean or Great Lakes) | 232 mi | 238 mi |
| Elevation (USGS 3DEP) | 2,603 ft | 2,509 ft |
| Terrain Relief within 20 mi | 849 ft | 1,145 ft |
| Terrain Relief within 40 mi | 2,231 ft | 3,551 ft |
| Golf Courses / 100k (county) | 2.0 | 2.0 |
| Performing-Arts Companies (county) | 141 | 141 |
| Event Promoters (county) | 104 | 104 |
| Museums & Historic Sites (county) | 31 | 31 |
| Weekly Childcare Cost | $275.63 | $275.63 |
| Childcare Desert % | unknown | 42% |
| Private Schools / 100k | 2.5 | 2.5 |
| Congregations / 100k (county) | 42 | 42 |
| Adherents / 1,000 (county) | 433 | 433 |
| GOP Vote Share | 48% | 48% |
| Median Age | 42.8 yrs | 53.5 yrs |
| Pop. Change Since 2020 | +10.5% | +1.0% |
| Bachelor's Degree+ | 37% | 31% |
| Miles to Nearest 1M+ Metro | 13 mi | 22 mi |
| Winter Daylight (hrs) | 9.7 | 9.7 |
| Near Mountains | No | Yes |
| College Town | No | No |